| SOFTWARE |

Visual Bio includes a unique feature for clearly illustrating the relative redox condition of groundwater at each monitoring well. This feature allows users to define the direction on each axis at which concentrations will increase – either towards, or away from the origin of the radial diagram.
Figure 1 (below) shows an example of a redox radial diagram with six axes to represent groundwater concentrations for dissolved oxygen, nitrate, manganese, iron, sulfate, and methane. The axes are oriented in the preferential sequence at which the electron acceptors are utilized or metabolic by-products are formed. Under aerobic conditions, these electron acceptors will typically have relatively high concentrations. As shown on Figure 1, concentrations for these three electron acceptor axes are at a minimum closest to the origin of the radial diagram, and increase along each axis away from the origin. In this manner, higher concentrations for these electron acceptors under aerobic conditions will plot close to the outer extent of each axis as shown by the black symbols on Figure 1.
Metabolic byproducts such as manganese, iron, and sulfate will exhibit the opposite trend; that is, metabolic byproduct concentrations are relatively low under aerobic conditions, and will increase as conditions become more reducing (i.e. more anaerobic). Visual Bio incorporates a unique feature which allows radial diagram axes for metabolic byproducts to increase in concentration towards the origin of the radial diagram. As shown on Figure 1, relatively low concentrations of manganese, iron, and methane are plotted near the outer extent of each axis. So by allowing axes for electron acceptors and metabolic byproducts to increase in opposite directions, concentrations for each of these two classes of compounds will plot near the outer extent of a radial diagram under aerobic conditions.
The four radial diagrams shown at the top of Figure 2 (below) illustrate a typical transition from wells under aerobic conditions (MW-1), to nitrate-reducing (MW-2), manganese- and iron-reducing (MW-3), and sulfate-reducing / methanogenic conditions (MW-4). The green polygons represent redox indicator concentrations at each monitoring well. Note how the size of the green polygons becomes progressively smaller as conditions become more reducing. For reference, a second data series is plotted to illustrate concentrations under aerobic conditions, to allow for easy comparison with the redox indicator concentrations at each individual monitoring well.
Figure 2 compares the radial diagrams representing concentrations for six redox indicators at each of the four monitoring wells (top), to the tabulated concentrations (bottom). Inspection of Figure 2 indicates that it is much easier to identify the relative reducing conditions at each monitoring well by simply comparing the size of the green polygons in the radial diagrams, which is easier and faster than inspecting individual indicator concentrations in the table.
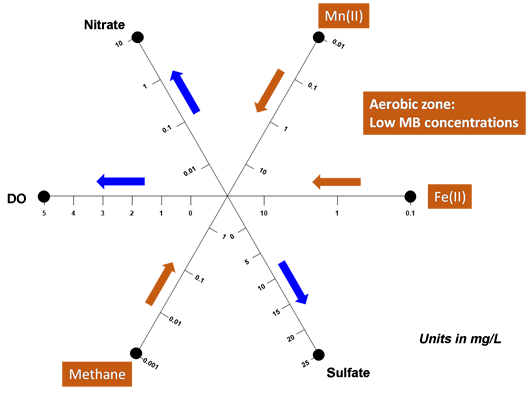
Figure 2 – Example of Transition in Redox Conditions Along a Flow Path
