| SOFTWARE |

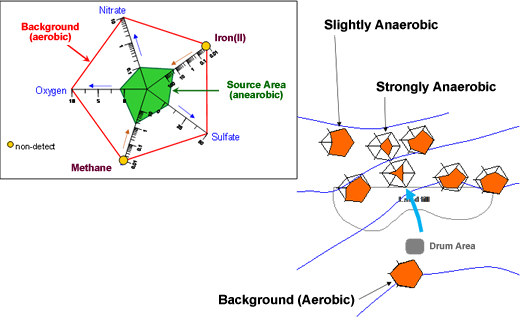
Radial diagrams may be useful for visualizing trends for organic and inorganic chemicals, particularly when evaluating the efficacy of natural or enhanced biodegradation processes. Modified radial diagrams are particularly useful for assessing the zonation of redox conditions in groundwater, and have been demonstrated by Carey et al. (1996, 1999, and 2003).
Visual Bio is a simple software tool to facilitate the plotting of radial diagrams for environmental applications. Click the links below to download:
- A presentation illustrating Visual Bio features and case study examples;
- A 1996 paper illustrating the radial diagram visualization concept for MNA at a Superfund Landfill Site, based on the earlier software called SEQUENCE.

The purpose of Visual Bio is similar to an earlier program named SEQUENCE (Carey, 1999), which was developed by Grant Carey with funding from Conestoga-Rovers & Associates (now GHD). Given that SEQUENCE is no longer available, Visual Bio has been developed to provide a tool for environmental professionals to use for evaluating the degree to which chemicals are degrading in groundwater.
Visual Bio may be used to plot radial diagrams at monitoring well locations on a site map, to facilitate a comparison of chemical concentrations and/or environmental properties such as oxidation-reduction potential (ORP), pH, specific conductance, turbidity, etc. Each axis of a radial diagram represents one chemical or environmental property.
There are two types of data series which may be plotted on radial diagrams with Visual Bio:
- Monitoring event series which represent well-specific data; and/or
- Reference series which represent conditions that are uniformly drawn at all well locations (e.g. background redox indicators or source concentrations).
Including reference series on radial diagrams facilitates the visualization of relative changes in chemical concentrations or environmental properties over time or distance.