|
|
Visual PFAS™ Features
Visual PFAS™ provides a simple and easy-to-use interface for creating radial diagram and stacked bar maps, which are ideal for supporting PFAS site characterization, remediation monitoring, and forensic assessments.
Visual PFAS™ enables you to save time, improve your conceptual site model, and more effectively communicate the results of PFAS sampling and remediation with key stakeholders. |
|
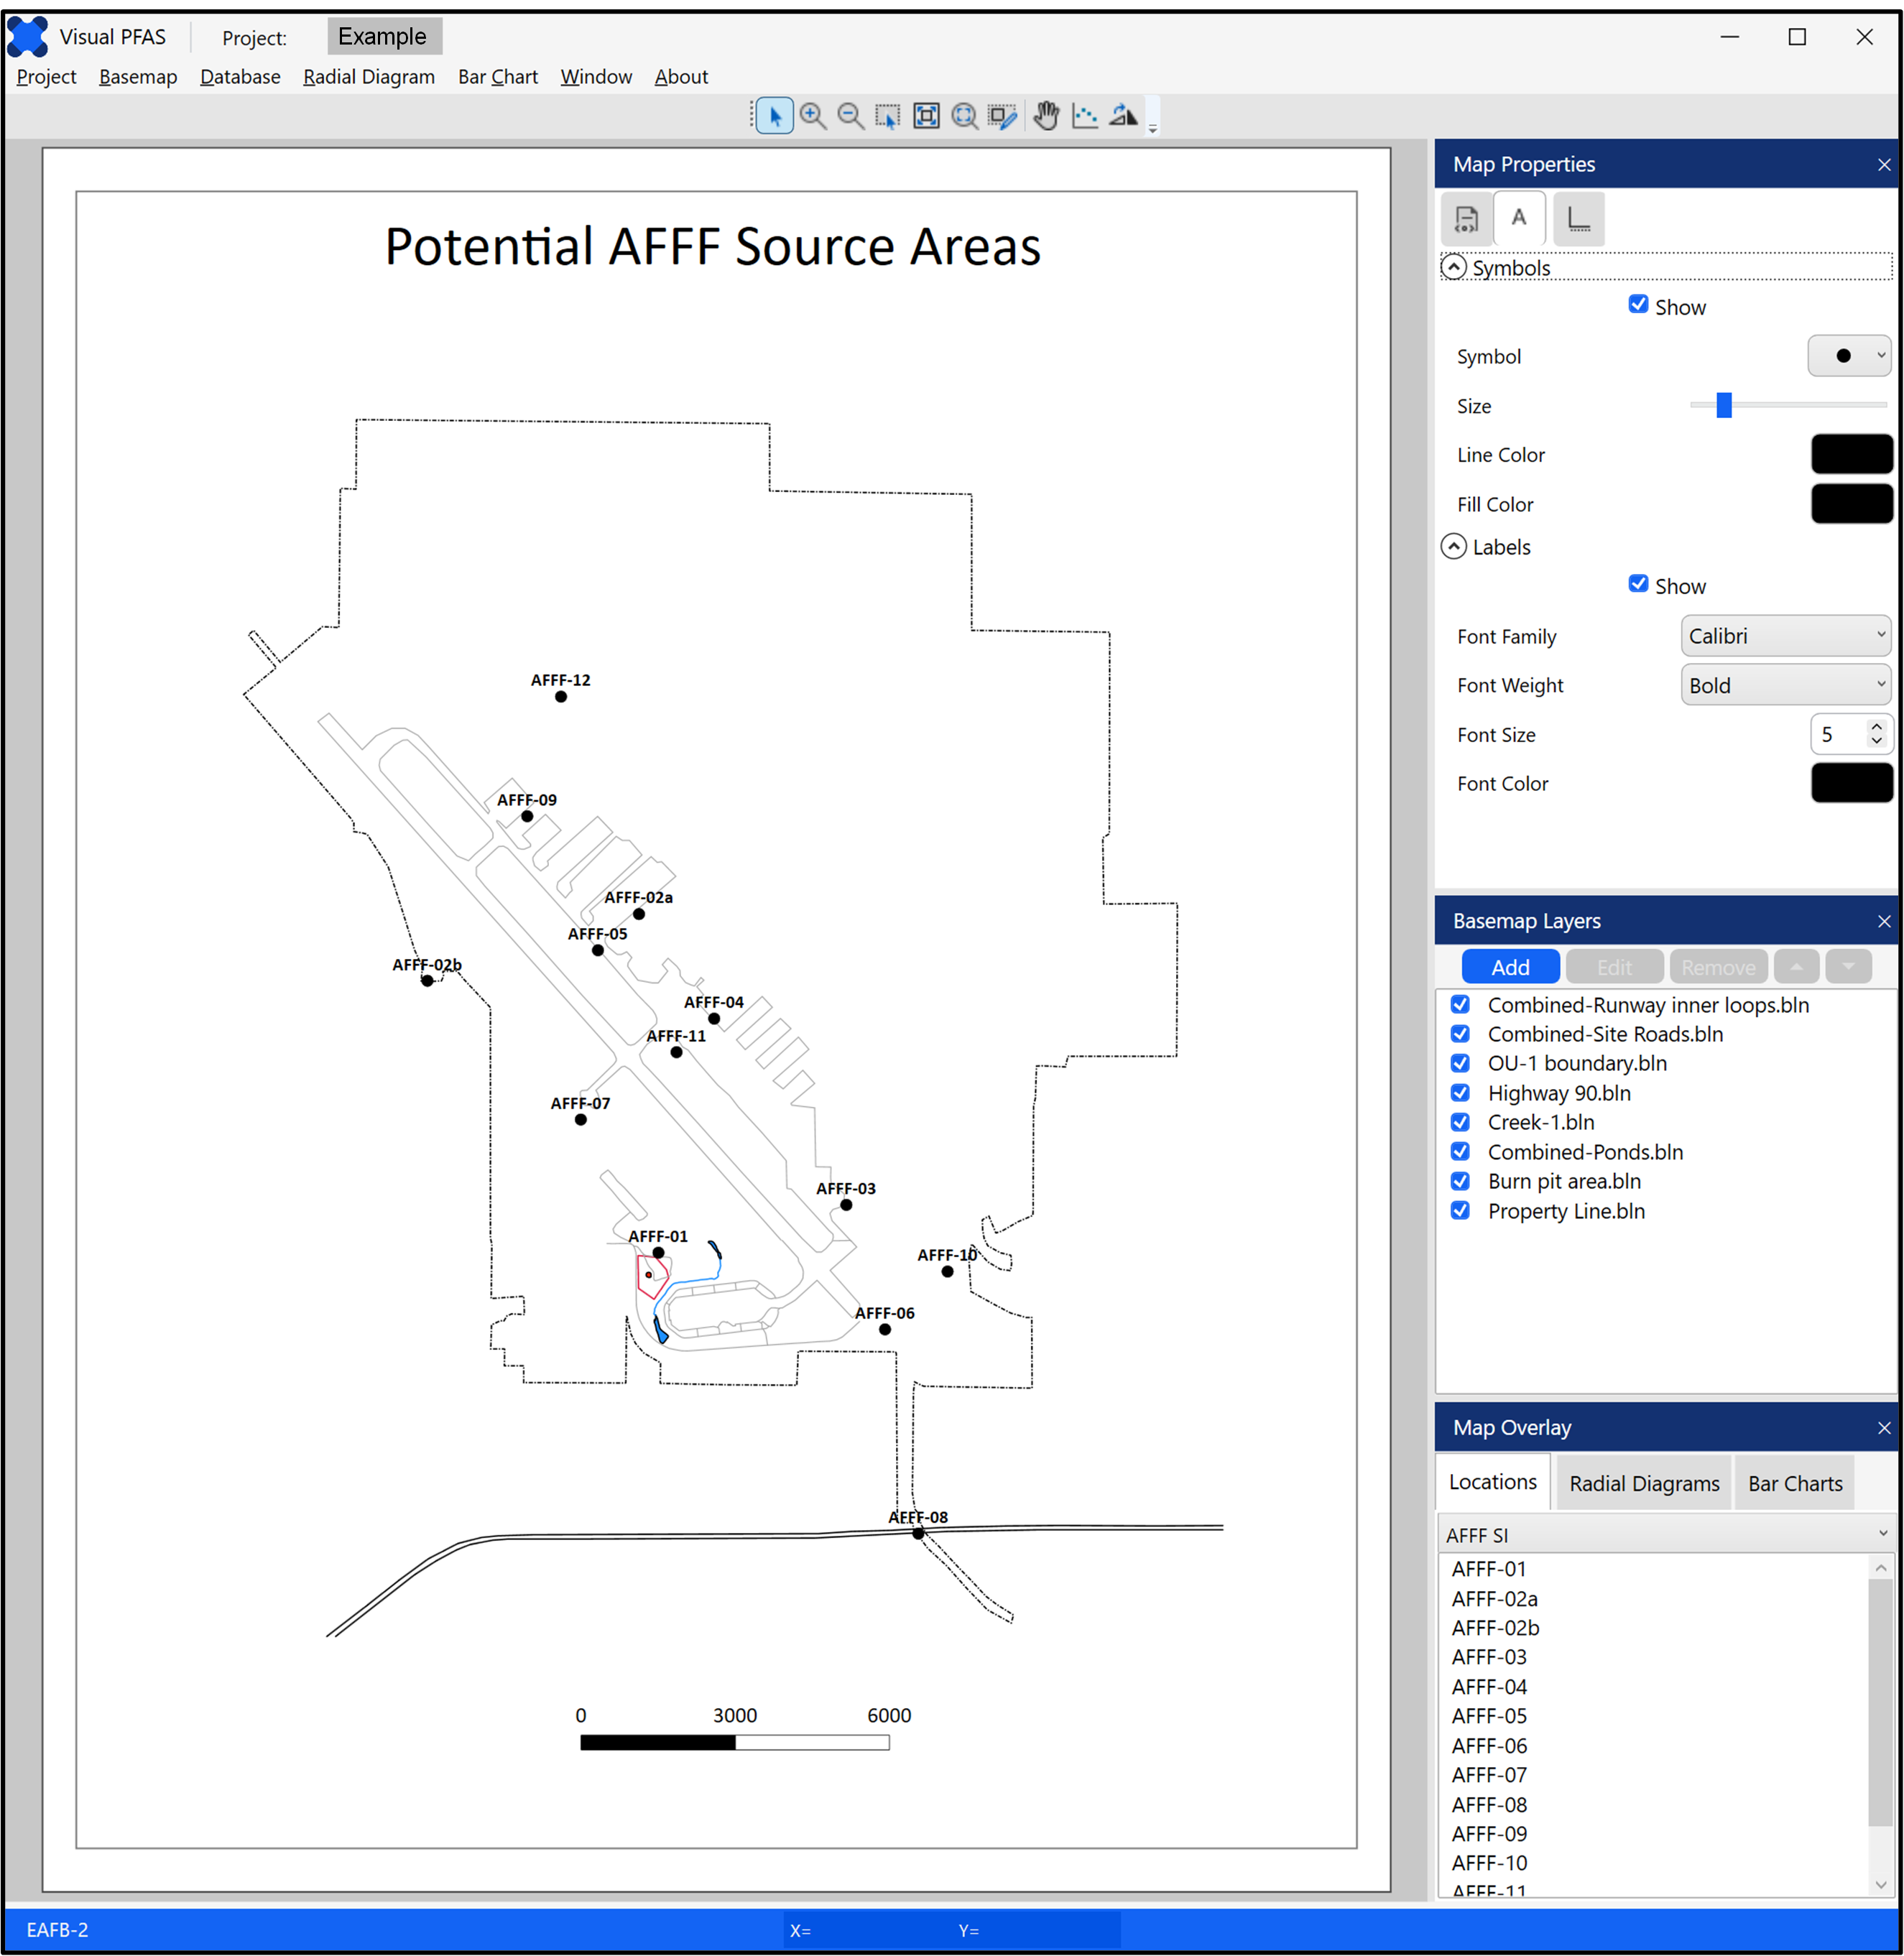
Visual PFAS™ Basemaps
- Import map layers in *.shp, *.dxf, *.bln format
- Easily add, edit, and delete map layers: line colors, fill, line weights and style
- Plot all or a select group of monitoring well locations
- Optional coordinate axes and scale bar styles
- Plot one or more radial diagram and stacked bar maps with the basemap underlay
- Create multiple basemaps for different focus areas at a site
|
|
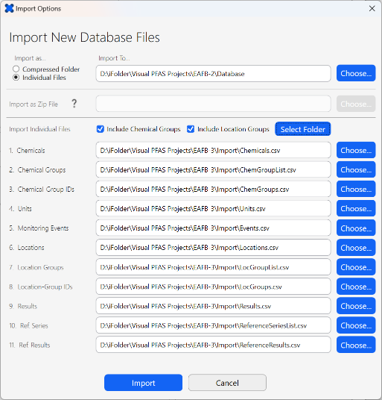
Visual PFAS™ Project Database
- Import project database files in *.csv format
- Locations and location group lists
- Chemical properties, cleanup criteria, and group lists
- Monitoring events list
- Chemical analytical results
- Automatic concentration unit conversions
- Reference series lists and analytical results (e.g., source or background)
|
|
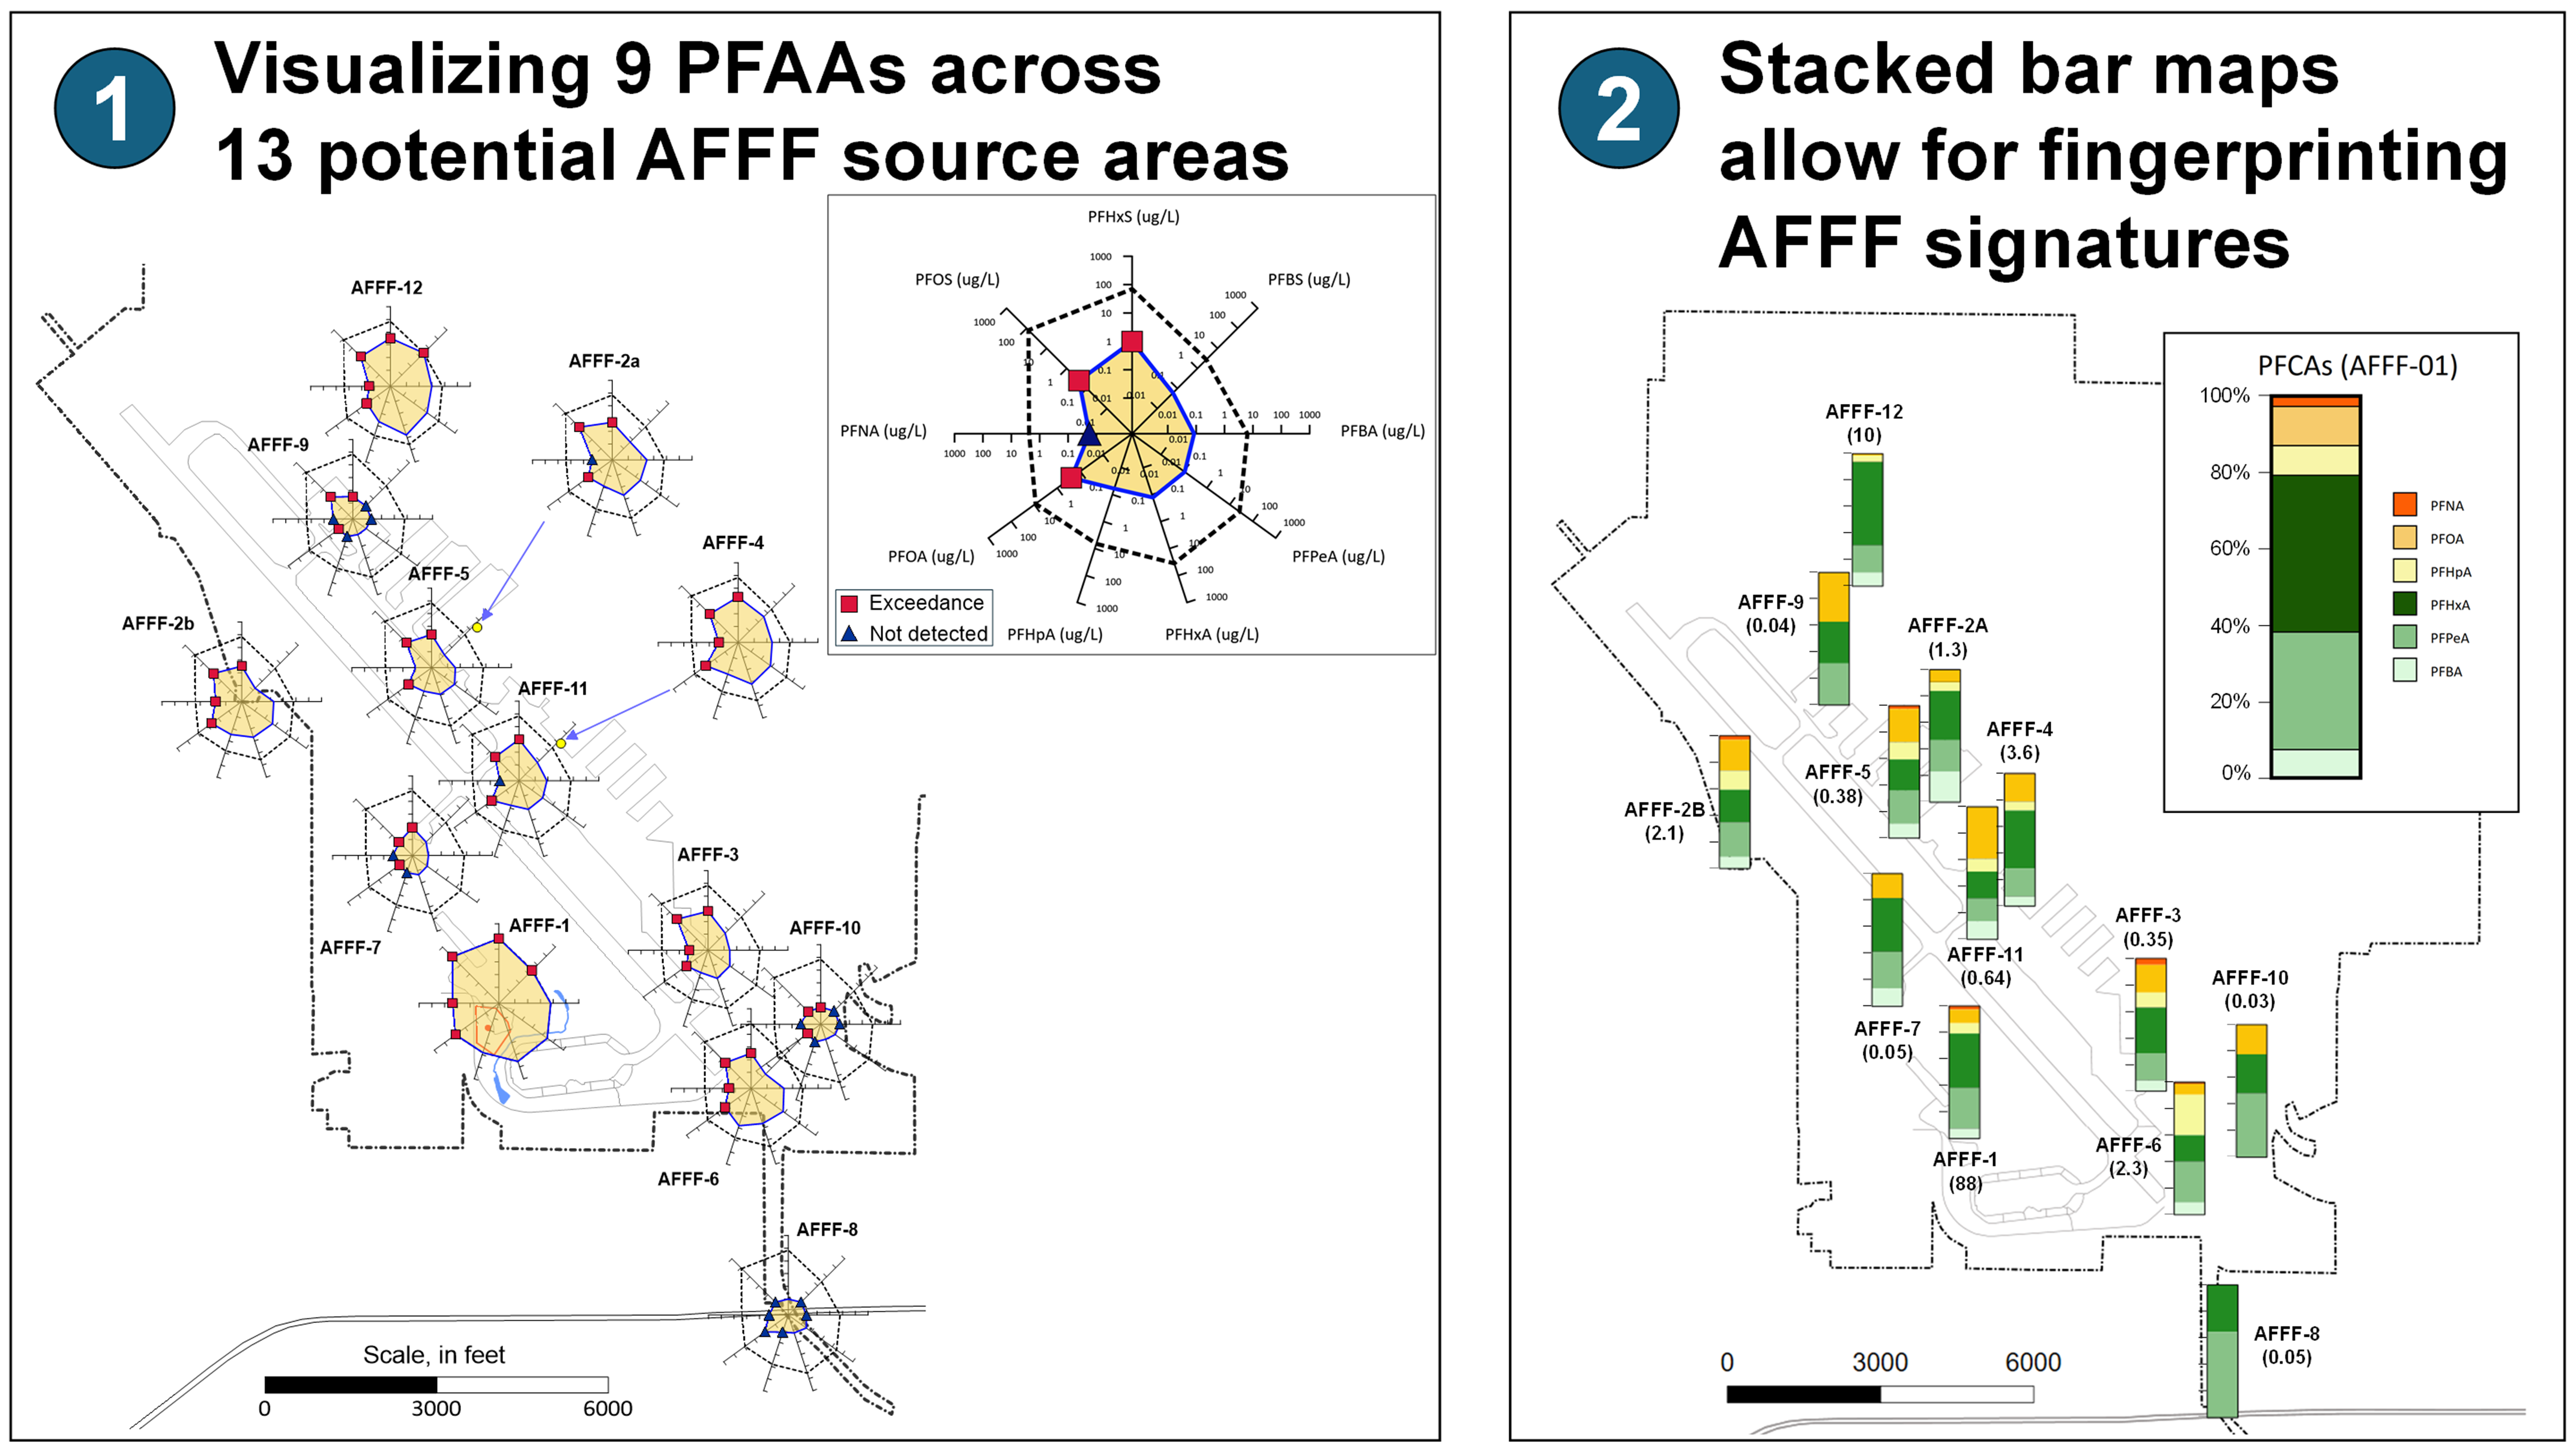
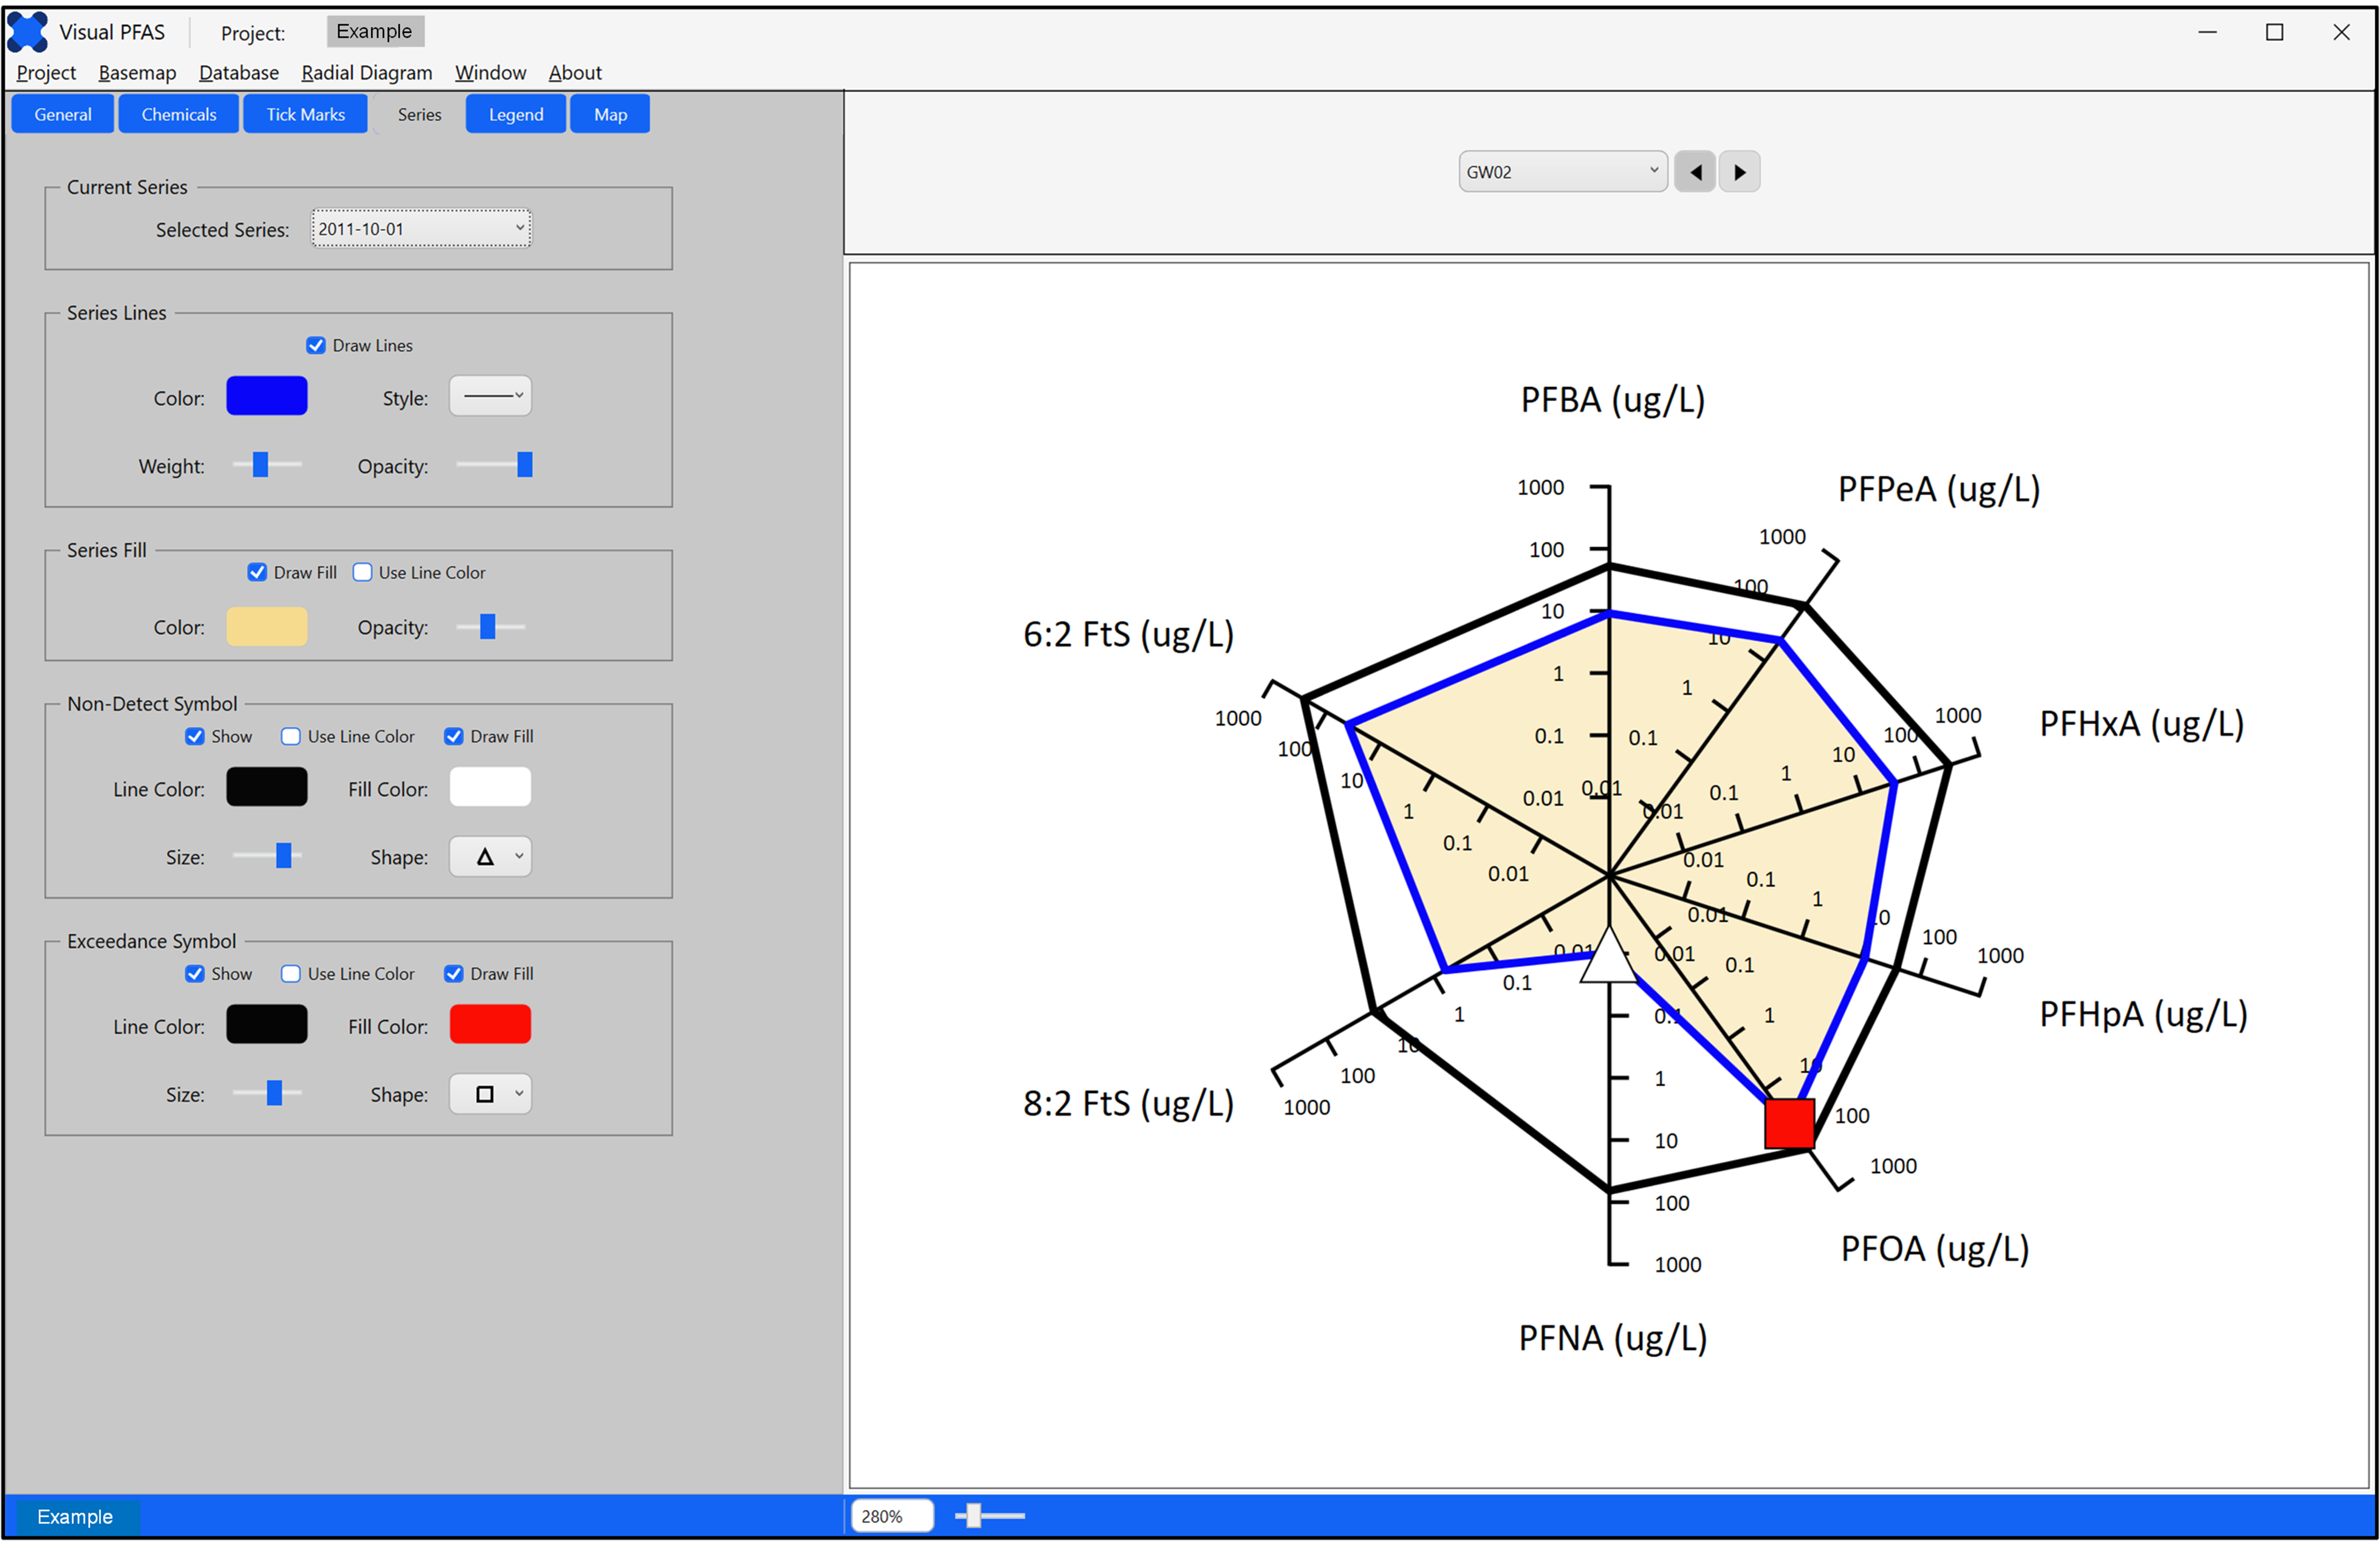
Visual PFAS™ Radial Diagrams
- Select no. of axes and assign chemicals, concentration units, log or arithmetic scale
- Select monitoring events and reference series
- Select well or boring locations
- Plot concentrations or PFAS ratios
- Edit series line and fill properties
- Add exceedance and non-detect symbols
- Easily offset radial diagrams to avoid overlap at adjacent wells on a site basemap
|
|
Visual PFAS™ Stacked Bar Maps
- Select chemicals, monitoring event, and monitoring well locations for stacked bars
- Add stacked bars as a layer to site basemap
- Optical tick marks to estimate chemical proportions at each monitoring well
- User-specified chemical sequence and colors
- Ideal for forensic fingerprinting to differentiate PFAS sources, and for TOP assay visualization
|
 |
|
|