| SOFTWARE |
|
|||||||||

Click here to download the NDM LNAPL Case Study presentation.
Reference: Carey, G.R., 2015. Modeling LNAPL Depletion at a Former Xylene Processing Facility (Germany), accepted as platform presentation at Cleanup 2015 Conference, organized by CRC Care, Melbourne, Australia, September 13-16 (invited presentation).
ABSTRACT
Non-aqueous phase liquids (NAPL) present below the water table will undergo natural depletion because of ongoing dissolution into groundwater. The NAPL Depletion Model (NDM) is a screening-level model that was developed to simulate declining source strength trends for NAPL source zones based on naturally-occurring or enhanced dissolution (Carey et al., 2014a). NDM is a public domain model and is available for download at www.porewater.com. NDM was used to simulate LNAPL depletion at a former xylene processing plant in the lower Rhine area in Germany, over a period of 4.5 years during operation of a groundwater extraction system. Schafer and Therrien (1995) previously used a sophisticated three-dimensional reactive transport model to simulate the xylene plume derived from a residual LNAPL source zone that is approximately 120 m long and 70 m wide.
Based on their modeling work, Schafer and Therrien (1995) determined that vertical transverse dispersivity and the LNAPL penetration depth into the aquifer were critical parameters which influenced the simulated source strength (and thus the rate of LNAPL dissolution). This is consistent with the occurrence of both surface discharge (Mdsurf) due to dissolution at the lower LNAPL surface, and through-discharge (Mdthru) as groundwater flows through the LNAPL zone (Figure 1). Schafer and Therrien used their model to calibrate a transverse dispersivity of 10 mm, which is 20 to 50 times larger than anticipated based on measured values at other sites. There were not sufficient field data available for the characterization of LNAPL architecture and smear zone thickness.
NDM was used to compare the relative magnitudes of surface and through-discharge for the xylene LNAPL source zone based on an alternative conceptualization, using a much smaller transverse dispersivity value (0.22 mm) based on the regression equation derived in Carey et al. (2015), and a larger effective thickness for the LNAPL smear zone (1.7 m, versus 0.17 m that was used in the original study). The thicker smear zone is consistent with the large drop which occurred in the water table elevation over the remediation period, during which significant xylene dissolution was still occurring.
The simple 1-D screening level model (NDM) incorporated 20 grid cells, to allow for simulation of the influence of depleting source zone length on the dissolution rate. The observed mass discharge was estimated based on data presented in Schafer and Therrien (1995). An exponential decline term was derived to represent the declining through-discharge rate based on the observed decline in water table elevation (Figure 2). Calibration was not required for the NDM simulation because input parameters were site-specific, or estimated with regression equations based on hydraulic conductivity (e.g. Carey et al., 2015).
NDM was demonstrated to be a valuable tool for improving our understanding of site factors which influence NAPL depletion, refining the NAPL architecture characterization, and for comparing the relative benefit of enhanced versus naturally-occurring NAPL dissolution. Through-discharge was shown to be initially the dominant dissolution process, with declining influence as the water table declined. Figure 3 illustrates that there is a relatively good match between the observed and modelled mass discharge (i.e. dissolution rate), which validates this alternative architecture conceptualization (i.e. low transverse dispersivity and initially thick smear zone). Also, the use of pump-and-treat is shown to increase the xylene LNAPL dissolution rate by 100% (Figure 3). This supports the use of strategic pump-and-treat (SP&T) as a treatment technology for LNAPL, as discussed in Carey et al. (2014b).
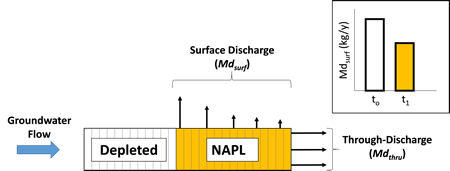
Fig. 1. NDM conceptualization of mass discharge components for LNAPL dissolution.
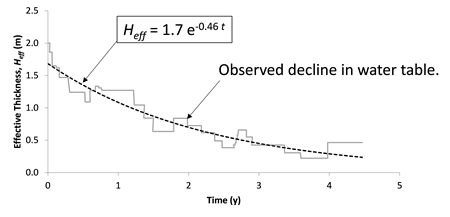
Fig. 2. Fitting of an exponential decline model for effective NAPL source zone thickness, based on the declining water table elevation.
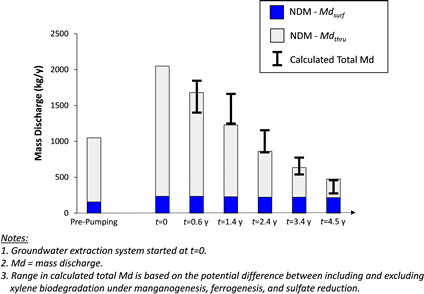
Fig. 3. Observed and modelled mass discharge trends.
REFERENCES
Carey, G.R., McBean, E.A., Feenstra, S. (2014a) DNAPL source depletion: Predicting rates and timeframes. Remediation J., Summer 2014.
Carey, G.R., McBean, E.A., Feenstra, S. (2014b) DNAPL source depletion: Attainable goals and cost-benefit analyses. Remediation J., Fall 2014.
Carey, G.R., McBean, E.A., Feenstra, S. (2015) Estimating Vertical Transverse Dispersivity Based on Hydraulic Conductivity and Groundwater Velocity. In preparation.
Schafer, W. and Therrien, R. (1995) Simulating transport and removal of xylene during remediation of a sandy aquifer. J. of Contaminant Hydrology, 19: 205-236.